1 Intro and Background
Introducing my first environment made for Prime Intellect’s RL Residency. I wanted to create a medical environment since I haven’t seen many out there. I figured pathology would be an interesting one, we get told quite often that models will cure diseases and make vaccines. Throwing compute so that we can hillclimb medicine is one of the best, if not the best, uses of reinforcement learning. A world in which doctors, scientists, and nurses are 100x more productive due to super intelligence is a world I see very soon, and in my opinion, a world that is much better than one with just more productive engineers.
Mitosis Bench. A pathology benchmark where an agent has to find every mitotic figure in a tumor image. Gemini 4 Argon leads all models with 32.4% pass@1. GLM 5.3 Flash dominates in performance relative to cost.
| Model | pass@1 | pass@2 | pass@3 | pass@4 | pass@5 | Cost per attempt | Model calls per attempt | Minutes per attempt |
|---|---|---|---|---|---|---|---|---|
| Gemini 4 Argon | 32.4% | 37.9% | 40.4% | 42.0% | 43.0% | $0.364 | 18.0 | 5.6 |
| Claude Opus 5.5 | 28.6% | 33.7% | 36.2% | 37.4% | 38.0% | $0.178 | 6.2 | 1.1 |
| GPT-6 Astra | 22.8% | 28.2% | 31.1% | 33.2% | 35.0% | $0.549 | 19.3 | 4.7 |
| GLM 5.3 Flash | 16.8% | 25.6% | 31.7% | 36.6% | 41.0% | $0.065 | 26.6 | 6.2 |
| DeepSeek V4.1 Flash | 8.8% | 14.3% | 18.8% | 22.6% | 26.0% | $0.155 | 68.0 | 22.1 |
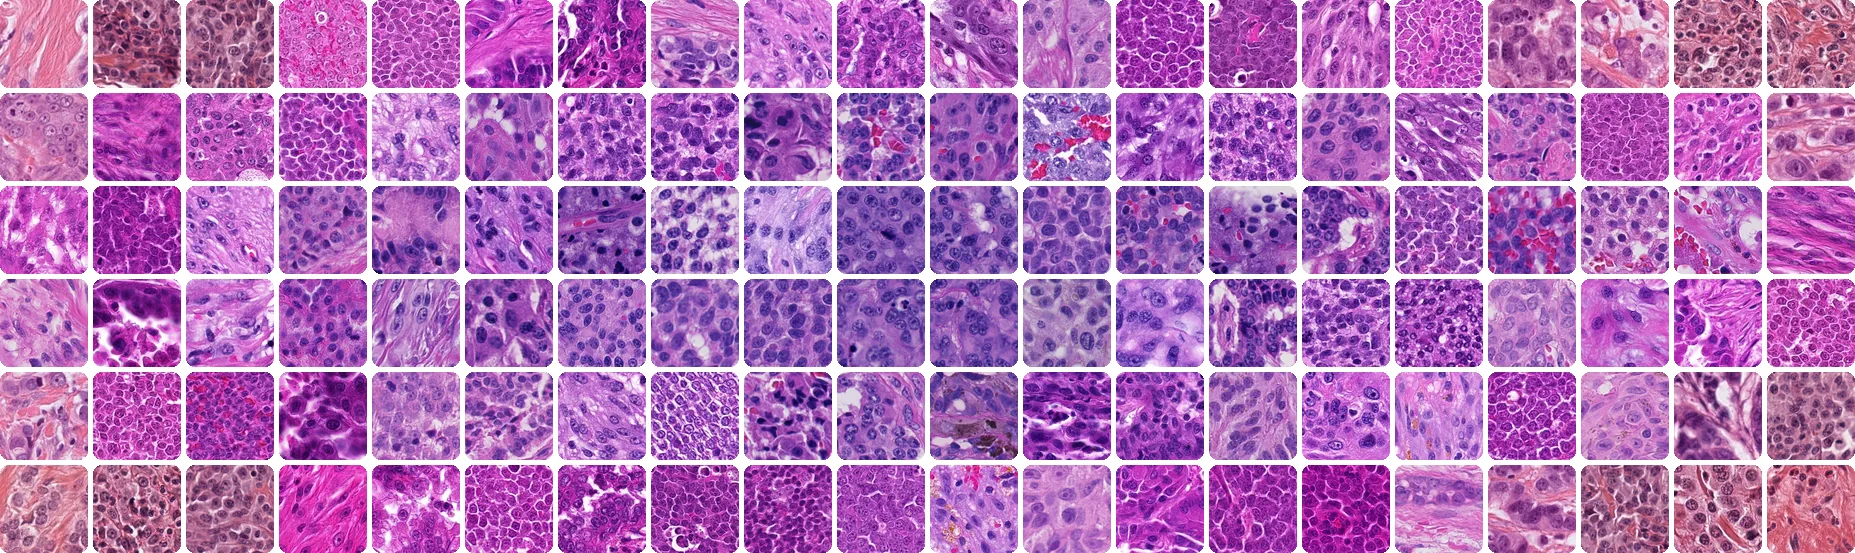
What is a Mitotic figure? A mitotic figure is a cell caught in the act of dividing, visible under the microscope. Pathologists use mitotic figures as an indicator of how fast a tumor is growing.
(a) mitotic figures

(b) look-alikes

About the Dataset: The dataset is MIDOG++(https://www.nature.com/articles/s41597-023-02327-4) , which is an extension of the MIDOG (Mitosis Domain Generalization) challenges. I chose a mitosis dataset specifically because I anticipated that models would struggle with identifying really small figures and navigating data where the amount of look-alikes outnumber real figures. MIDOG++ has 503 tumor regions of 7 tumor types: breast carcinoma, lung carcinoma, lymphosarcoma, neuroendocrine tumor, cutaneous mast cell tumor, cutaneous melanoma, and (sub)cutaneous soft tissue sarcoma. This dataset combines both human and dog histological specimens and is labeled by expert consensus.
| Tumor type | Species | Regions | Mitotic figures | Look-alikes | Look-alikes per figure |
|---|---|---|---|---|---|
| Breast carcinoma | Human | 150 | 1,721 | 2,714 | 1.58 |
| (Sub)cutaneous soft tissue sarcoma | Dog | 100 | 1,286 | 2,375 | 1.85 |
| Lymphosarcoma | Dog | 55 | 3,959 | 4,257 | 1.08 |
| Neuroendocrine tumor | Human | 55 | 639 | 1,761 | 2.76 |
| Cutaneous mast cell tumor | Dog | 50 | 2,327 | 1,366 | 0.59 |
| Cutaneous melanoma | Human | 49 | 1,150 | 925 | 0.80 |
| Lung carcinoma | Dog | 44 | 855 | 951 | 1.11 |
| All 7 | Human and dog | 503 | 11,937 | 14,349 | 1.20 |
2 Task and Reward shape
For the input the agent was given a 768 x 768 px tissue image and a prompt explaining what its looking at and telling it to find every mitotic figure. The agent is NEVER told: how many cells there are, how many figures there are, the 30px match radius, or the tumor type. It is evaluating it similarly to how a pathologist would in a real work environment. The agent is told to output its answer in the format of “ Answer: [[x,y], …] on a 0-1000 grid.
(a) input
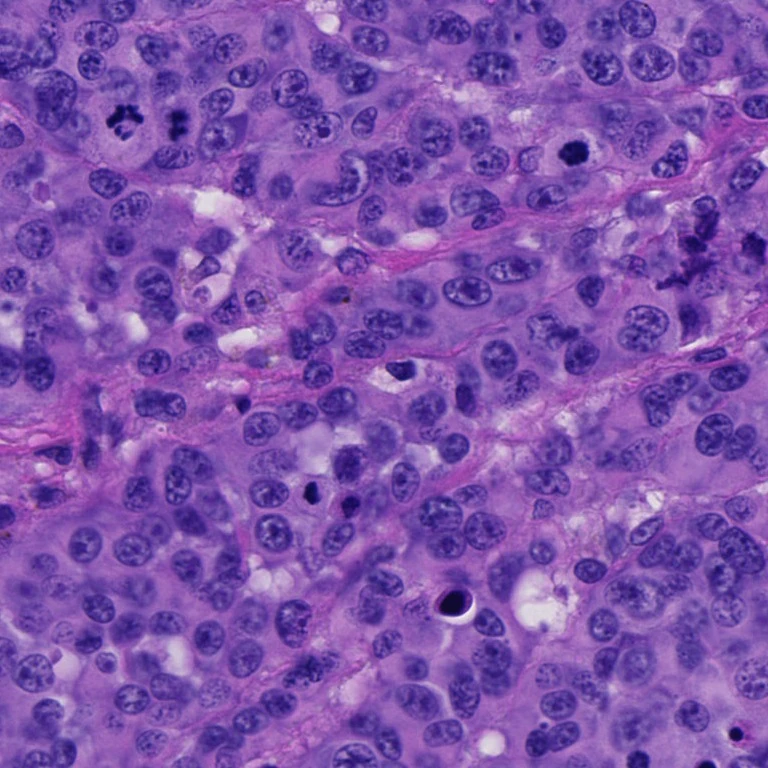
(b) expert labels
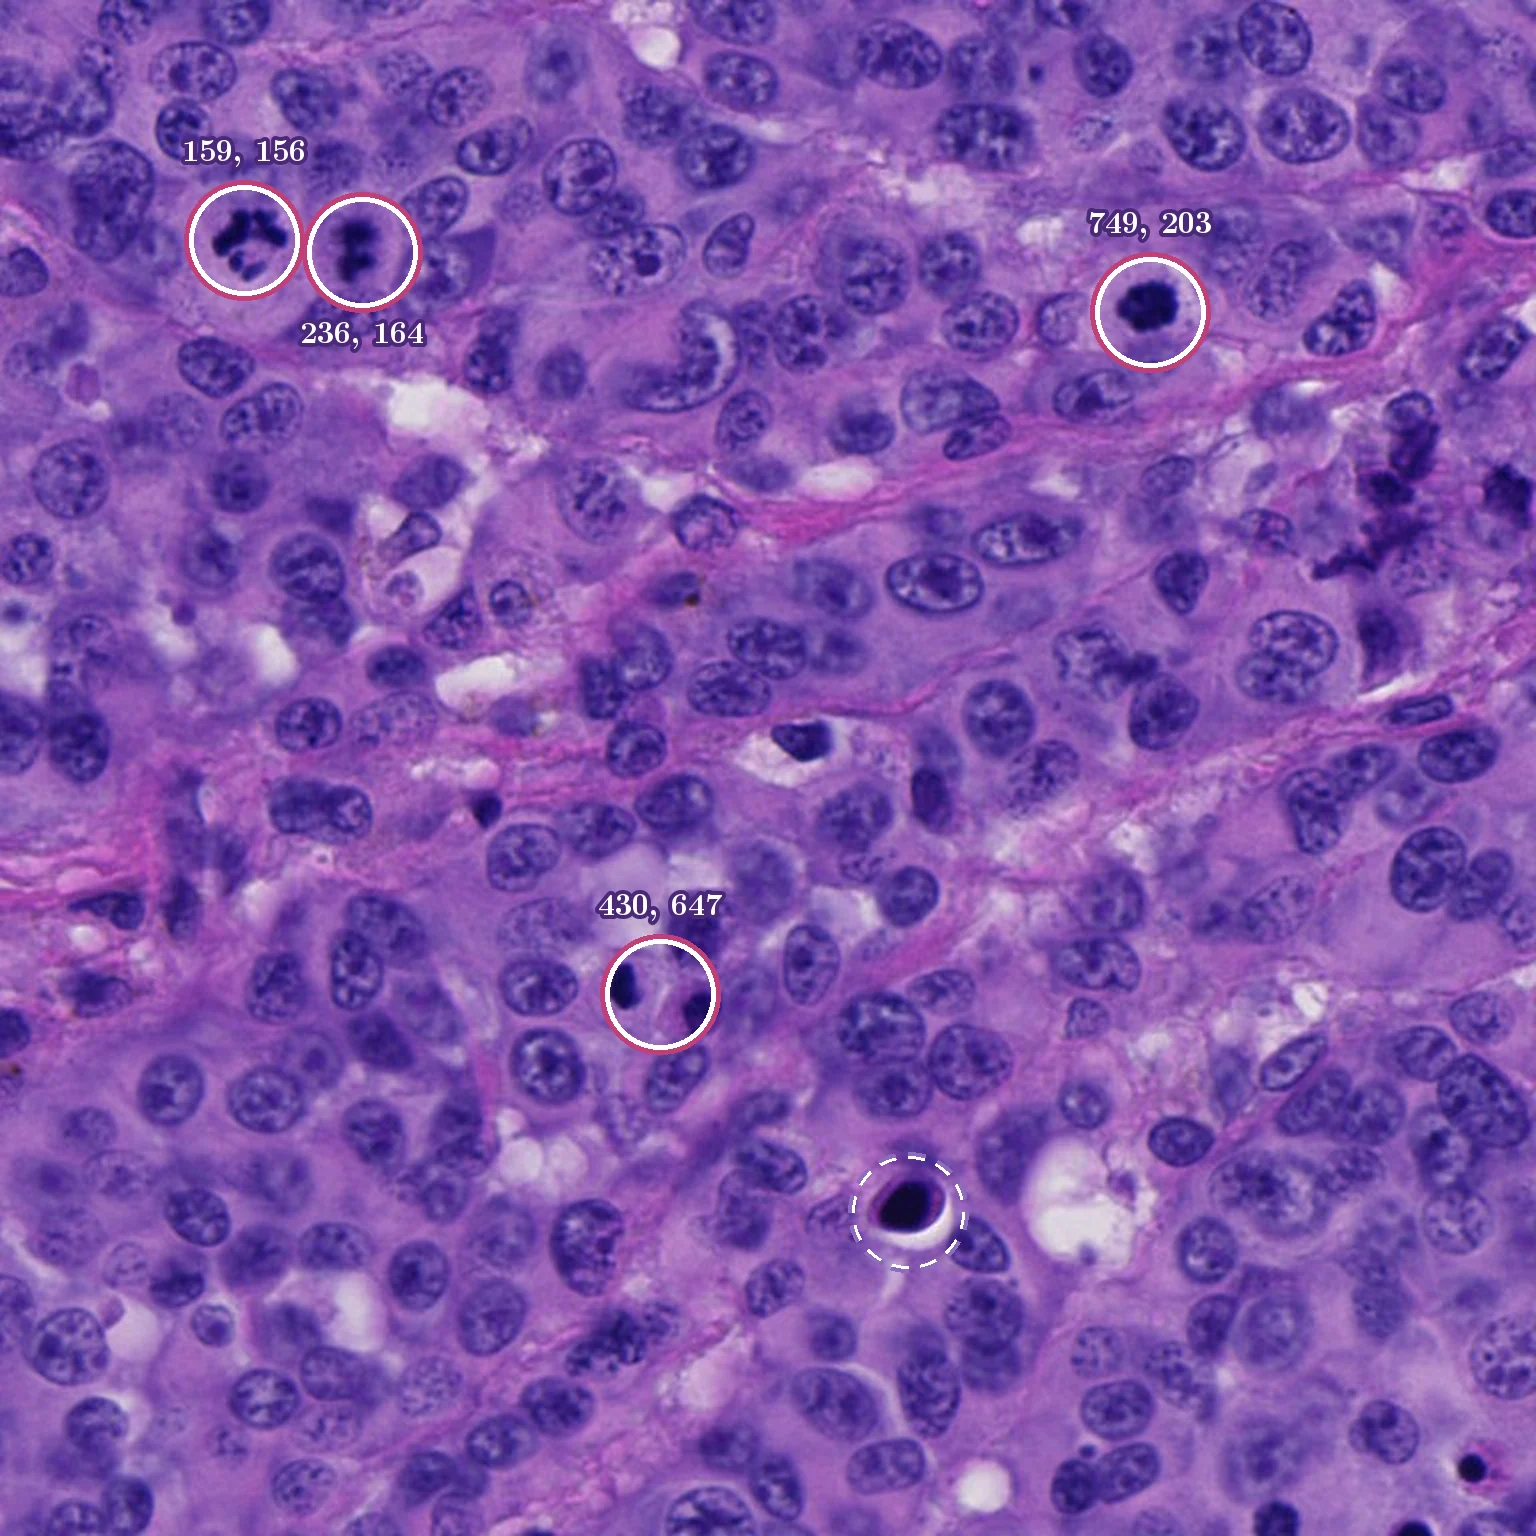
Reward: I used a binary reward, it would only get the reward if the answer matches exactly the right cells within 30 px (7.5 µm which is the MIDOG challenge’s radius) with no extra or missing cells. No partial credit since we don’t have a judge and I could see partial credit opening up some reward hacks for the models. I still recorded precision and recall accuracy so we could diagnose failure. The agent gets no tools aside from the general tools Pi offers: read, bash, edit, write. The environment can be used with arbitrary harnesses as long as they are supported in verifiers, I just decided to use Pi. Rather than using the entire dataset I selected only images where the experts agreed on all the labels and where there were three or more figures. I divided that subset into 357 tasks for training, 64 tasks for validation, and 100 tasks for model evaluation. The benchmark was run on the 100 evaluation tasks across 55 different microscope slides and 7 different tumor types.
| Benchmark | Value |
|---|---|
| Tasks | 100 |
| Microscope slides | 55 |
| Tumor types | 7 |
| Image | one 768 × 768 px field (97 tasks), or two side by side, 1536 × 768 px (3 tasks) |
| Mitotic figures per image | 3 to 7, mean 3.2 |
| Answer | Answer: [[x, y], …], each center on a 0–1000 grid |
| Reward | 1 if every figure is matched within 30 px and nothing is extra, else 0 |
| Attempts per task | 5 |
3 Running the Evals
All the models ran through a Pi harness on high reasoning effort. For each task I ran 5 rollouts and I only allowed retries if there was an infrastructure failure. I ended up having to retry most of deepseeks attempts since I ran into a bit of an interesting issue during evaluation, 147 attempts failed with a “Downloaded image content cannot exceed 30MB failure”. After running some tests I found out that the reason behind this was that agents saved zoomed PNG crops and since the harness would resend every image on every turn the requests piled up. To fix this I added a small local relay that re-encoded any non-JPEG image(the agents PNG crops) as JPEG. Everything else passed through the relay unchanged. To prove that this didn’t affect the eval results I measured performance with/without the relay, I used Opus as the control group (since it never hit the limit) and its score moved only +0.9 points. Deepseek ended up rising from 6% to 8.8% because the cap failures disappeared. In order to make sure there was no cheating I scanned every single tool output for all attempts for answers, scoring text or ids and found nothing.
4 Results
Something interesting to note from the chart is that Opus stops very early, especially on tasks it fails. In 334 out of 500 of its attempts it lists too few points. Deepseek makes 68 model calls per attempt while Opus only makes 6! Another interesting thing is that of the 100 tasks, Opus never solves 62 of them but there are 19 tasks it solves every time. On the other hand, 38% of tasks GLM attempted had some attempts pass and others fail. By pass@5 GLM achieves frontier level performance, at a huge discount compared to the other models! Opus and Astra struggle to get to 40% throughout the benchmark (although Opus uses an average of 87 reasoning tokens compared to Astras 158) The mixed result tasks are perfect for RL!
| Model | Requests | Reasoning tokens per request | Thinking time per request | Thinking time per attempt |
|---|---|---|---|---|
| Gemini 4 Argon | 9,014 | 429 | 12.8 s | 3.5 min |
| Claude Opus 5.5 | 3,117 | 87 | 5.3 s | 0.5 min |
| GPT-6 Astra | 9,667 | 158 | 10.7 s | 3.8 min |
| GLM 5.3 Flash | 13,321 | 267 | 7.6 s | 4.3 min |
| DeepSeek V4.1 Flash | 33,988 | 462 | 8.2 s | 13.3 min |
Conclusion: Thank you for reading and a huge thank you to the Prime Intellect team, especially Sebastian. I hope to continue building and create tools that help doctors become even more capable than they are today. If you are interested in chatting about RL / evals / more , feel free to email me: dtirandaz@gmail.com